LIOR SKOURY
>Space. append (Behavior)
There is a connection between the built environment and the behavior of the people who use it. The architectural effort to understand this connection is based mainly on human intuition. With the help of contemporary data collection and processing technologies, it is possible to prove this connection and to use these insights for more precise and qualitative urban planning, based on the human factor as the catalyst for generating the space.
The project presents a planning system based on forecasting the effect of spatial changes on human behavior. The system builds a set of possible spatial changes so that its implications will serve as guidelines for the planner's urban agenda.
The global trend of populations shifting to urban centers poses vital questions about the character of the city. The old and new cities constantly ask themselves, "What is the right way to expand?" In the last two decades, there has been a trend of using technological tools in the world of architecture to address this issue. Nevertheless, the vast majority of the work of architects and planners is still being done by Computer Aided Design (CAD) software, built in the late 1980s as an extension of the traditional pencil and ruler. But computers are capable of much more than this in their ability to merge with the mind of man acting as a generator of ideas. This combination exposes a fresh look at the city, encouraging intelligent, bottom-up planning based on the city's information. Furthermore, it adapts the city's character to it, and may provide an answer to the question of the city in the 21st century.
The project is accompanied by a 150-page theoretical work that reviews the relevant literature and thesis.
The project was conducted as a final project in Bezlael Academy.
Advisers: Erez Ella, Iddo Ginat
Year: 2017
Exhibits: 'Opportunity' , 2018, ZEZEZE Gallery.
'The Akko Convention on Urbanism', 2018, Akko.
Team: Noam Burg, Lior Skoury, Shahar Abelson


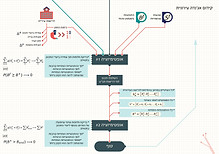
How does the system works:
Level 1 – Collecting and arranging the data
Level 2 – Generating the forecasting tool
Level 3 - Planning recommendations based on the forecasting

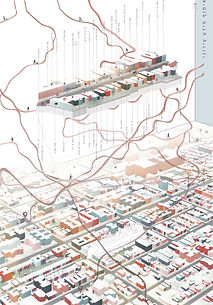
Collecting and arranging the data.
Finding the city pattern.
applying the results on the future planing.
Level 1.
At this stage, data is collected from various sources and cross-linked in order to produce as broad an image as possible of the space.
The information collected is divided into two sections:
Spatial information that includes any spatial or social data obtained.
Behavioral Information - GPS Information on how people behave in the city.
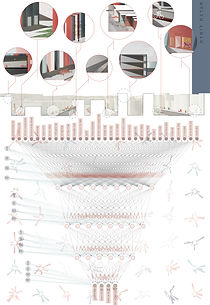
Level 2.
Finding a mathematical relationship between
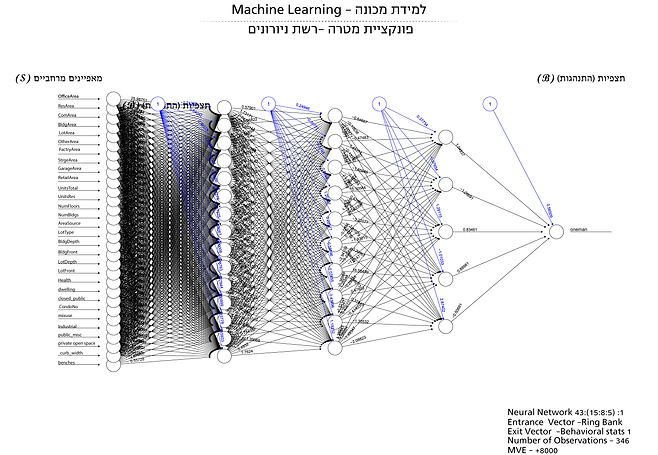
sets of measurable spatial characteristics and the pedestrian behavior data in order to analyze the movement patterns in the space.
At this stage, using Machine Learning technology, the system generates close predictability of the effect of spatial change on behavior in the street segment and the impact of change on behavior in neighboring segments.
Level 3.
At this stage, the system produces concrete planning recommendations based on an analysis of the city's vision and the relationship found in Level 1.
The city's vision is represented by behavioral measures and planning goals on the one hand, and limitations on the other. The system creates an optimal spatial layout that meets the planning goals, based on the defined behavioral parameters and limitations. The optimization relies on predictive ability from Level 1, and offers the program that will best promote the city's vision.

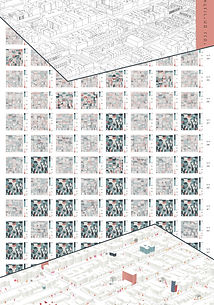
The first thing we should address is how we divided the city. Here, we relied on a theory of Space Syntax that says a section of a city is always defined from intersection to intersection. We referred to each section as a 'segment'.


After we divided the city, we began to address the behavioral information (the GPS data), and for each segment, we gathered the relevant information. In addition, the information in each segment was divided into different categories.
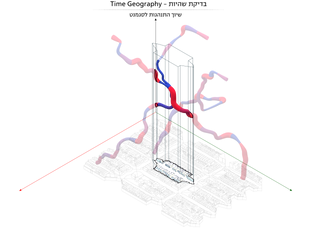
Here, too, we relied on an existing theory called Time Geography. In short, the theory adds the dimension of time to the world axis as the dimension of height so that as one progresses in space, time passes and the representation of its path rises upward.


We then proceeded to collect and analyze the spatial information. The information was collected from NYC OpenData, and organized in a way that allowed us to utilize it efficiently. The information collected included building information, information on the use of space, street information, demographic information, and climate information.
As with the behavioral information, the information was collected for each segment.
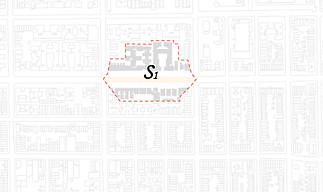
The ring is the area of all possible walking paths within 500 meters of the center of the segment.
Understanding that a segment also affects the segments surrounding it, we decided to increase the influence of spatial data to the ring.


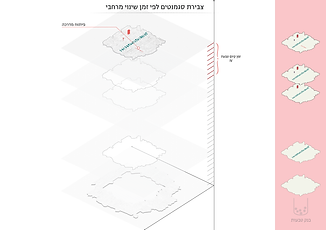
We had the spatial data and behavioral data, but there is another aspect that defines the space: time. In order to introduce this aspect, we began by layering the rings according to the changes applied over time. Eventually, we created a 'ring- bank' with spatial data for each ring containing a segment with its behavioral data at its center.
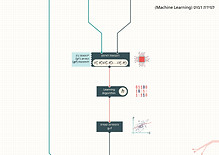

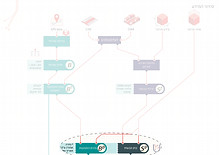
At this stage, all of the information was organized, and we were able to start the machine learning process.
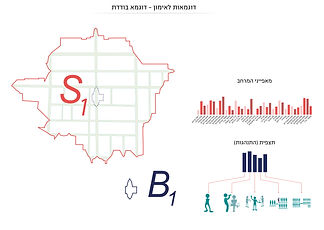
Our input vector was the ring with the spatial information (S), and the output vector was the behavioral information of each segment (B).

In many ways, the world of architecture is finding it difficult to keep pace with the development of technology and how to apply it.
Examples, precedents, studies, and tools that use technological capabilities in favor of planning, for the most part, refrain from addressing non-quantitative architectural questions. As a result, these projects offer either a production-oriented or an engineering point of view, or they offer mappings that prove difficult to remain relevant when translate into design.
Our aim in creating this system was to create an infrastructure that would be able to harness technological tools.
In order to create a better manufactured environment that treats its users as important, the system refers to the users of spaces as the core component.
Although the system still has some gaps in its implementation, we hope that this project will give practical and strategic thought to a smart city that is not merely a statistical engineering solution. A smart city is one which uses the data collected frequently for the benefit of its residents, because the people of the city are the ones who create it.
After we learned the pattern, it was time to implement it.
The goal was simple: to increase the use of a certain space in the city. Here, we began to play with all sorts of possibilities with a genetic algorithm, with the understanding that one change in the city could affect the rest of the city until the desired result was achieved.
The system does not replace the planner, however, it does enable them to gain valuable insight into the way they approach planning, focusing on the effects on the urban space.